The (R)eproductive rate is how many people, on average, a currently infected person will infect before their case is resolved by death or recovery to immunity. An R below 1 means the number of new infections should decline. An R above one means disease spread is increasing.
R is rebounding.
April’s shut down brought national R to well below 1.0. A few states had R’s just above 1 but national progress had slowed spread to a point where our hospital systems had a fighting chance.
RT.live is a near real-time, open-source calculation of state by state R’s. Their estimate from yesterday is sobering.
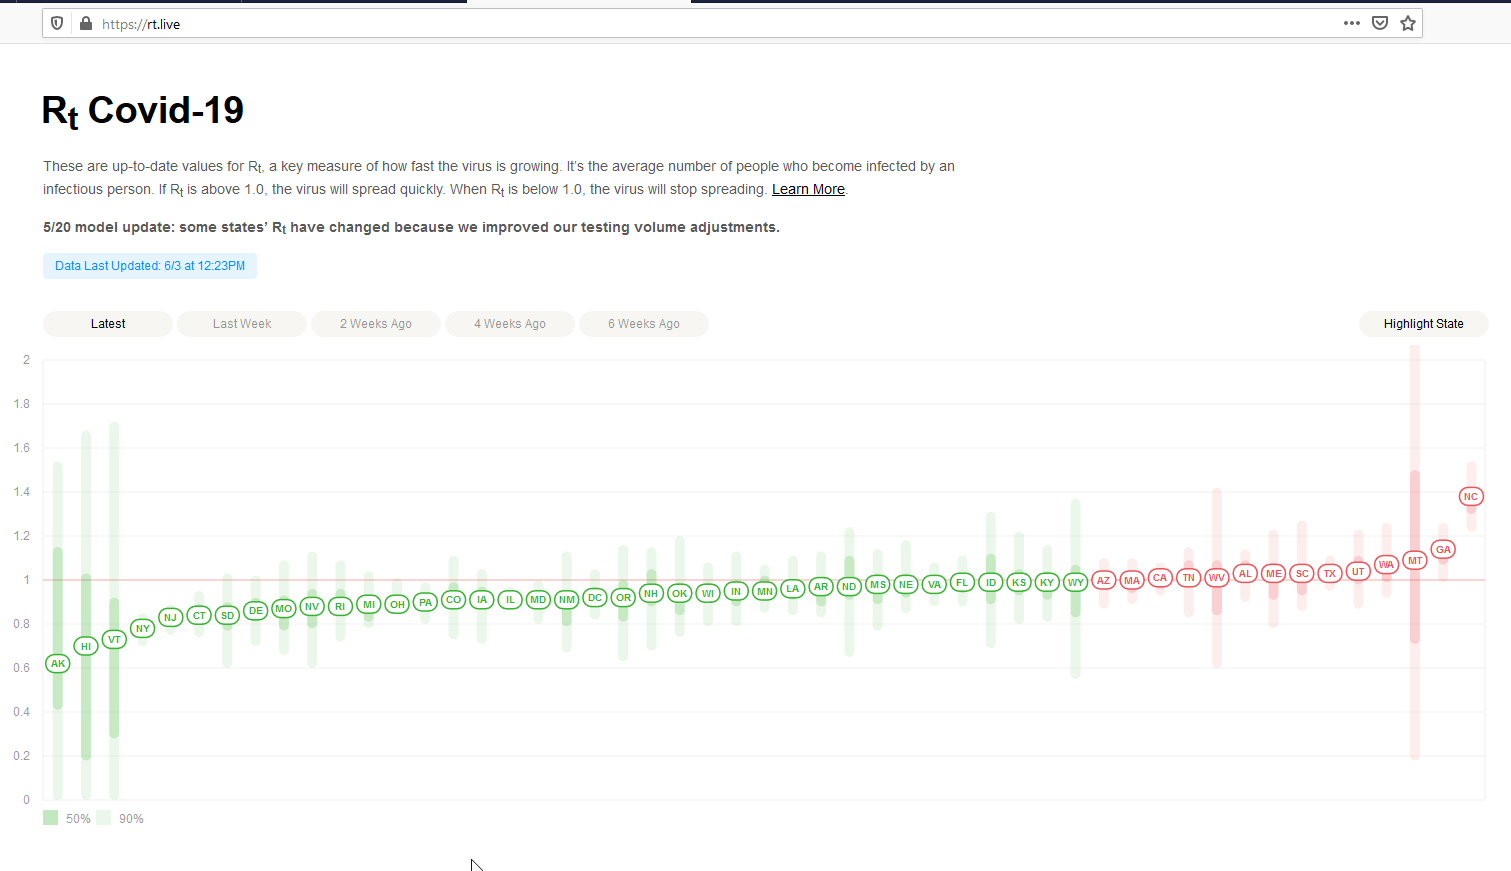
Fourteen states have estimated R’s above 1.0. North Carolina has a point estimate of 1.38.
These estimated R’s are based on diagnosis, so although the estimate is for June 3, 2020 the data is really reflecting new infections that occurred on roughly May 29, 2020. The R trend is up in large states again. And these trends are happening before protests but after re-openings have occurred.
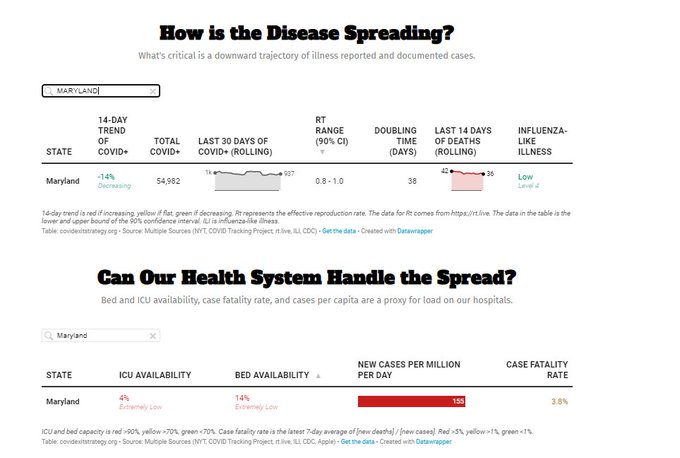
Even in states that have R below 1 like Maryland, we have a potential set of problems as the current stock of people who need medical care is not clearing from the hospitals fast enough to create space for people who will need medical care in the near future.
If the protests are to generate an upswing in R, we will see it first in Minnesota in the next day or two and then elsewhere by early next week. The econometricians and epidemiologists will need to apply some fairly powerful tools to figure out what component of the R upswing is protest related, and what component is the underlying trend from re-opening.
But the baseline pre-protest but post-re-opening is that R was going up, and in some states, spread is broad and lightly controlled at best.
raven
Crap and I just scheduled my dental cleaning for next week.
WereBear
I knew it would take longer for rural areas to get it; and to understand that they have it.
artem1s
Pentecost services were last Sunday. So another week before those infections start to show up? Suburban and rural American is about to get hit hard.
Uncle Cosmo
Working from what I learned about airborne transport and diffusion from 15 years working in chem/bio defense, my guess is that, other things being equal, getting people outside will tend to drain the stir-crazy out of them without perceptibly affecting R – warm weather will increase the atmospheric mixing height & thus dispersal of airborne droplets in the vertical direction.
But that’s only if they stay outside. As soon as the really hot weather hits (already here in Bawlmer – 95 & humid yesterday) the outside folks are naturally going to scurry inside where it’s cool. Crowded, enclosed public environments (bars & restaurants) are ideal for COVID-19 spread.
IMO we are more likely to see a bump in R 10-14 days after the onset of high summer than from the protests. Early to mid-July.
wvng
And Israel and South Korea having trouble reopening schools. And a tropical storm heading toward Louisiana this weekend. And unidentified “police” in the nation’s capital mixing with with white supremacists in their cosplay gear and protesters will have no way to know who has authority. And protesters being rounded up and put into tight spaces with a bunch of other people during a pandemic. Just another day ending in “y” during the time of Trump’s American Carnage.
Another Scott
Thanks for this.
For emphasis, “This model assumes infectiousness begins with symptoms. While future versions may correct for this, a simple heuristic is to shift all values of Rt 5 days into the past.” It’s good to keep that in mind.
It’s a great resource – I hope it gets more visibility.
I also hope they find a way to tease out clusters and “super-spreaders” – somehow – from the state data. The situation is different if R is rising in cities than if it’s rising in isolated locations (meat packing plants, prisons, nursing homes). Yes, nursing homes don’t get it from the potted plants, but they have lower interactions than, say, a restaurant district in a large city.
I’m not optimistic that granular data like that will be available to normal people without a push from state and federal governments (and may new legislation). :-(
Thanks again.
Cheers,
Scott.
Mary G
MP
The AEI’s Covid tracker here is interesting as well, as it attempts to quantify risk at a county level. Normally, I would run from anything stamped with the AEI imprimatur, but Scott Gottlieb has seemed pretty even-handed.
Gin & Tonic
@Mary G: Too bad both Borglums (pere et fils) are no longer with us to embark on a quick project of adding a raised middle finger to one of the heads there.
artem1s
you know, any other year a flyover a national monument the day before the fourth wouldn’t draw any attention. In this case, I gotta go with “the Dumbass thinks he belongs up there with the rest of them”.
No One of Consequence
@Uncle Cosmo: Good points, sound reasoning. Thanks.
– NOoC
Johnny's mom
Cue up blame-it-on-the-protesters in 5, 4, 3…
data schmata
David Anderson
@MP: Disclaimer: My boss (Dr. Mark McClellan) is working and writing a lot with Scott. From what I’ve seen, Scott is doing his best to apply rigor and expertise to what is fundamentally a very messy and ill structured problem. He might be wrong on some things but the wrongness is coming from the same spot that his right calls are coming from — good faith and rigourous application of expertise to the available evidence.
cain
@Mary G:
What a waste of money. We need to spend that on more PPEs since we are going to be heading for an upswing. I swear to God, this govt is going to bankrupt all of us with their incompetence.
Barbara
@David Anderson: Agree. Scott Gottlieb has been trying since the beginning to steer policy in a sane, evidence based direction. The administration could have done a lot worse than to hire him to oversee its response. I am still in a state of complete amazement that Trump’s narcissism is so deep he cannot see that even pretending to care and expressing concern would put his chances of reelection on a much higher plane.
Matt McIrvin
MA just had an illusory spike of new cases that was caused by the state adjusting their case reporting to include positive antibody tests as probable COVID, and publishing the backlog of existing cases so classified. If you backdate them to the testing date it goes away (there still isn’t a lot of antibody testing happening, so it then doesn’t affect the numbers much). A lot of the aggregators don’t seem to be adjusting for this.
Uncle Cosmo
“Super-spreaders” driving infection is the real wild-card here. In the simplest assumption, there are two types of infection-spreaders: (i) a very few people who infect a lot of others, and (ii) everyone else, who hardly infect anyone. If one in a hundred is of type i, then the overall infection rate is (0.01)R(i) + (0.99)R(ii). If (on the average) each type i individual infects 100 others, while type ii individuals each infect 0.1 others, then the overall transmission rate is
(0.01) x (100) + (0.99) x (0.1) = 1.099 > 1.
If you could even cut the type i transmission rate by 20% (to 80), then the overall transmission rate is
(0.01) x (80) + (0.99) x (0.1) = 0.899 < 1.
IMO the most critical task for epidemiology right now is to track down the super-spreaders, collect as much information as possible from them, and apply every trick of data analysis to determine what (if anything) they have in common. Again IMO, it would be much easier to develop special protocols for treating those people than to try & protect the much larger numbers of people in vulnerable categories (old, co-morbidities, etc.) from them. Maybe we can get the cruise ship owners to refurb their fleets & offer all the superspreaders all-expenses-paid vacations of several weeks in the Bahamas or the South Pacific (while building up medical infrastructure & response capabilities at the designate ports-of-call)….Yeah, pricey, but maybe not compared to a simmering pandemic.
raven
@Uncle Cosmo: Can we have a definition of “super spreader” please?
raven
@Matt McIrvin: People had a fucking fit when they did that here in Georgia.
Jim Appleton
@Uncle Cosmo:
?Porque no los dos?
raven
”
A superspreader is an unusually contagious organism infected with a disease. In the context of a human-borne illness, a superspreader is an individual who is more likely to infect others, compared with a typical infected person. Such superspreaders are of particular concern in epidemiology.
Some cases of superspreading conform to the 80/20 rule,[1] where approximately 20% of infected individuals are responsible for 80% of transmissions, although superspreading can still be said to occur when superspreaders account for a higher or lower percentage of transmissions.[2] In epidemics with such superspreader events (SSEV), the majority of individuals infect relatively few secondary contacts.[citation needed]”
Barbara
@raven: Well, it’s only something that can be determined in retrospect, unfortunately, but the emerging consensus is that 80% of infections can be traced back to 10% of infected people, i.e., “super spreaders,” whereas the remaining pool of infected people might spread it to their family members but no further. It is not clear what makes someone a super spreader — clearly, being out and about rather than isolating is necessary, but it also appears to reflect the “viral load” that person has, such that their contact with others results in the transmission of a sufficiently high number of viral particles that nearly anyone they come in contact with will get the disease. It’s not clear what specific policy or public health interventions are suggested by this information.
Matt McIrvin
@raven: That wasn’t the only thing that happened in Georgia, if I recall correctly. The graph that caused the biggest flap literally just had the dates sorted out of order to show a decreasing trend. But it wasn’t the headlining graph in the report. The graph that had results backdated to the test date was a different one.
I was confused by this myself when I read the initial stories.
raven
@Matt McIrvin: roger
glc
Interesting link.
Still puzzled by California, why aren’t they doing better?
ChrisS
Flatten the curve wasn’t going to eradicate transmission. It was just buying time for the healthcare system.
The original CDC paper in 2007 discussing community mitigation anticipated a prolonged shutdown being ~12 weeks and they expected to be reopening schools after the growth was slowed even in the face of killer like the 1918 flu. There was no expectation that the country would continue shutdown forever.
scav
@glc: Especially with some of the larger states, you’ll run into the problem that they’ll have very different subareas. Seattle-side WA vs. the dry side, Chicago v. Downstate. Coastal CA v. Bakersfield et al. Like the US as a whole, some areas are driving it down (NY for the US) but the overall number may still be rising as the trends everywhere else start being revealed. (Plus the whole opening up rebound).
EmbraceYourInnerCrone
And this is my complete lack of surprise. This is going to last for a long time…
I am still going to work every day, fortunately my employer is taking this VERY seriously and no one gets in the building or works in the building, all employees included, with out wearing a mask. If you have an office you still have to put on a mask if someone is even just standing in your doorway, anyone walking around has to wear a mask. doors and elevators get disinfected hourly, so do the copiers and the lunch rooms. They sent home anyone who could do their job remotely back in March.
EmbraceYourInnerCrone
My Trumpie nephew and his born again family just traveled to Mississippi for a wedding. And he works in heath care. Arrrrggghhhh!
EmbraceYourInnerCrone
@ChrisS: Shutdown forever no, maybe have everyone follow good social distancing and masking protocols for a long time, that would have been a good idea, but in observing the beach towns and other areas of my Northern state I’m going to go with Nope.
We are going to have another spike.
Matt McIrvin
@EmbraceYourInnerCrone: Virginia currently has a higher per-capita rate of new cases than Massachusetts or New York. My parents live in a beach town there and they’re seeing tourists crowding into bars and restaurants by the shore. Mom, who is taking this dead seriously, just complained that she can’t make her two-week trip to the grocery store because they decided to remodel and the store is full of unmasked workers rebuilding the place.
Nevertheless, their statewide new-case rate is down a little over the past week or so. I’m wondering if that can sustain or if it’s driven by places like Richmond and NoVa.
Matt McIrvin
@glc: California is a big state and it may be impossible to generalize about it. But their overall case rate and death rate are still low enough that it may just be difficult to get people to take it seriously in most places.
It seems like there’s a social switch that flips somewhere around 100-200 cases per million per day; people get scared and tighten up–but at that point you’re already locked into a big surge that plays out over the next couple of months. CA’s done well enough that they never got there, but it means that people aren’t scared enough to really suppress the curve.
David Anderson
No the goal of the shut-down was to crush R low enough so that the hospitals were not overrun and thus had a fighting chance. That mostly worked outside of NYC. During this time period, test-trace-isolate capabilities were supposed to be stood up so that once we came out of the shutdown, aggressive and targeted public health interventions could keep case counts at a constant or decreasing level.
Seeing R go above 1 without sufficient test-trace-isolate capacity to build localized firebreaks is a bad thing.
glc
@Matt McIrvin: Thanks – I see two replies in much the same vein, but I believe there is more to it.
That CA is a large state is relevant if some (reasonably dense) areas are making strong progress while others are doing very badly. In that case the question would be, what are these areas and what are the relevant policy differences? But I haven’t seen an indication that this is the case.
My recollection of general reporting is that on the surface the state reacted strongly, and quickly, comparable to Washington, with a completely different result. Rural counties were problematic, but at this point the urban areas should still be dominating the statistics.
And they have particular problems at the southern border, but I wouldn’t expect that to have much weight in the state statistics either.
I’ve been paying closer attention at the state level to the NJ/NY area, and I understand that region. I was thinking someone from CA or might be able to set me straight as to what is really going on there. (Leaving aside the most recent developments, which aren’t reflected in the data anyway.)
glc
@glc: I don’t seem to have the ability to edit the foregoing.
Anyway more or less the next thing I came across was this (from May 16):
https://www.vox.com/future-perfect/2020/5/16/21254748/california-coronavirus-cases-lockdown
Which may or may not answer my question, but at a minimum states it plainly, and gives the relevant context.
Lymie
Checking out the website, the numbers have really changed since you posted, NC is not so high, MA has moved down, and the state by state plots over time don’t show the NC high number, so perhaps the data was wrong and has been corrected?