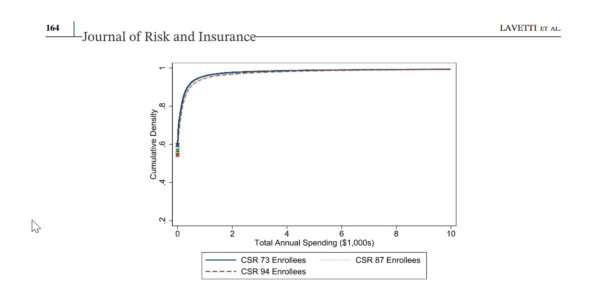
I’m lucky. I get to read interesting papers and I get paid for that privilege. This morning’s interesting paper is from the Journal of Risk and Insurance by Lavetti et al. It is in the new issue. They are looking at the spending of low income ACA enrollees in Utah who received Cost-Sharing Reduction (CSR) subsidies in 2014 or 2015. They are estimating elasticities of demand — if out of pocket spending goes up by a buck, what happens to service consumption? It is a very econ-y question but that is not what made me stop and write a Balloon Juice post. Instead it is the image below:
Two things stuck out to me. First I can’t differentiate differences between CSR 73 (201-250% FPL) versus CSR 94 (100-150% FPL)
Second, and this is an eyeball check, but about 90% of the people in the sample have under $1000 (if I squint hard, maybe $1200) in claims.
That slightly surprised me. I expected a priori 50% to have less than $500 in claims and then the 90th percentile to have $3000-$5000 in claims. This also shows the challenges of health insurance. Not many people use a lot of services while many people are paying premiums while using in a given year not that much in services.


edgefigaro
I’m seeing 90% using something like <$750 in claims.
CaseyL
What does the “Density” axis refer to?
It seems all the spending is consistent regardless of CSR.
That could simply mean that Utahans pay more attention to their health, and are therefore more likely to spend about the same amount; i.e., they do their preventive visits and don’t try to ignore symptoms (like most low-income people elsewhere do).
Keaton Miller
David, what was your prior about the difference in the distribution between the CSR groups?
David Anderson
@Keaton Miller: That is a complicated question.
All else being equal, an individual who is income eligible for CSR-94 would, be slightly worse health than an income CSR-73 eligible, especially at the ends of the income distribution as income embeds a lot of social determinants and access to care and living situations and stress.
However, we don’t see the eligible, we only see the enrolled. The CSR-94 population routinely was exposed to zero or very low premium plans 2014-2021 and almost universally exposed to zero premium CSR plans 2022-2025, so the marginal CSR-94 enrollee might be reasonably healthy. While the CSR-73 enrollee is never exposed to a zero premium plan so the marginal CSR-73 enrollee who could plausibly buy a zero premium Bronze plan is likely selected to be a bit sicker relative to the rest of the sub-cohort. At that point selection vs. SDoH gets messy.
I would have thought a priori that CSR-94 would be much higher spending than CSR-73 given Sen and Deliere’s MEdicaid expansion work and a not yet submitted term paper that I’m revamping from last semester for submission this summer….
David Anderson
@Keaton Miller: BTW — really nice work in Health Affairs this week.
David Anderson
@CaseyL: percentage of total people in the population.
Keaton Miller
@David Anderson: Thanks! A fun little project stemming out of some of our other work that has been grinding its way through peer review for some years now.
I think your story re: difference between CSR-73 and CSR-94 makes sense. I e-mailed the corresponding author to get a preprint — I don’t know that Utah dataset but I always wonder about underlying weirdness in the DGP.
phein63
I’m lucky. I get to read interesting papers and I get paid for that privilege.
I realize I’m very late to this thread, but this, a thousand times this:
Researcher is the best job in the world. I try to tell my own children and grandchildren, and all their classmates, but they lack perspective. I lucked into a career where I got to pick my own projects, travel the world and see interesting things, and try to find solutions to immediate problems. There are thousands of jobs like this, in and out of government, for moderately intelligent people who are curious and willing to work.