The Agency for Healthcare Research and Quality just released an update on my favorite health policy factoid — the distribution of spending in the US civilian non-institutionalized population over time using the Medical Expenditure Panel Survey (MEPS).
This is the overall distribution by selected percentiles:
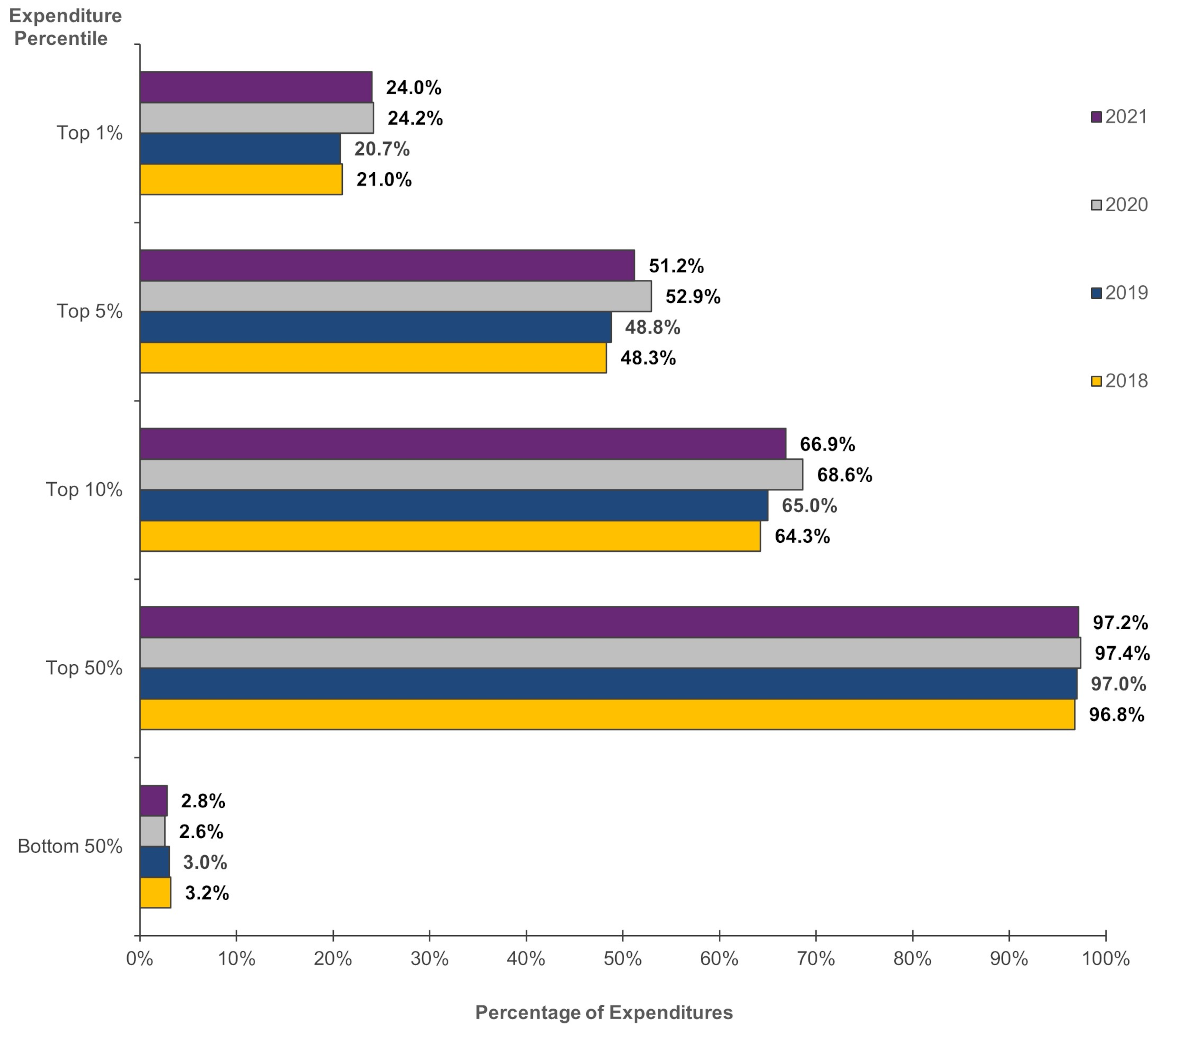
The first thing to remember is that we are seeing some COVID effects. Pre-COVID, the top 1% of the spending distribution uses about a fifth of all medical services and during early COVID, the top 1% uses just under a quarter of all services.
The top 5% (inclusive of the top 1%) generates about half of all spending plus or minus a wiggle. And the bottom half uses about 3% of total spend.
And here the dollar figures matter a lot!
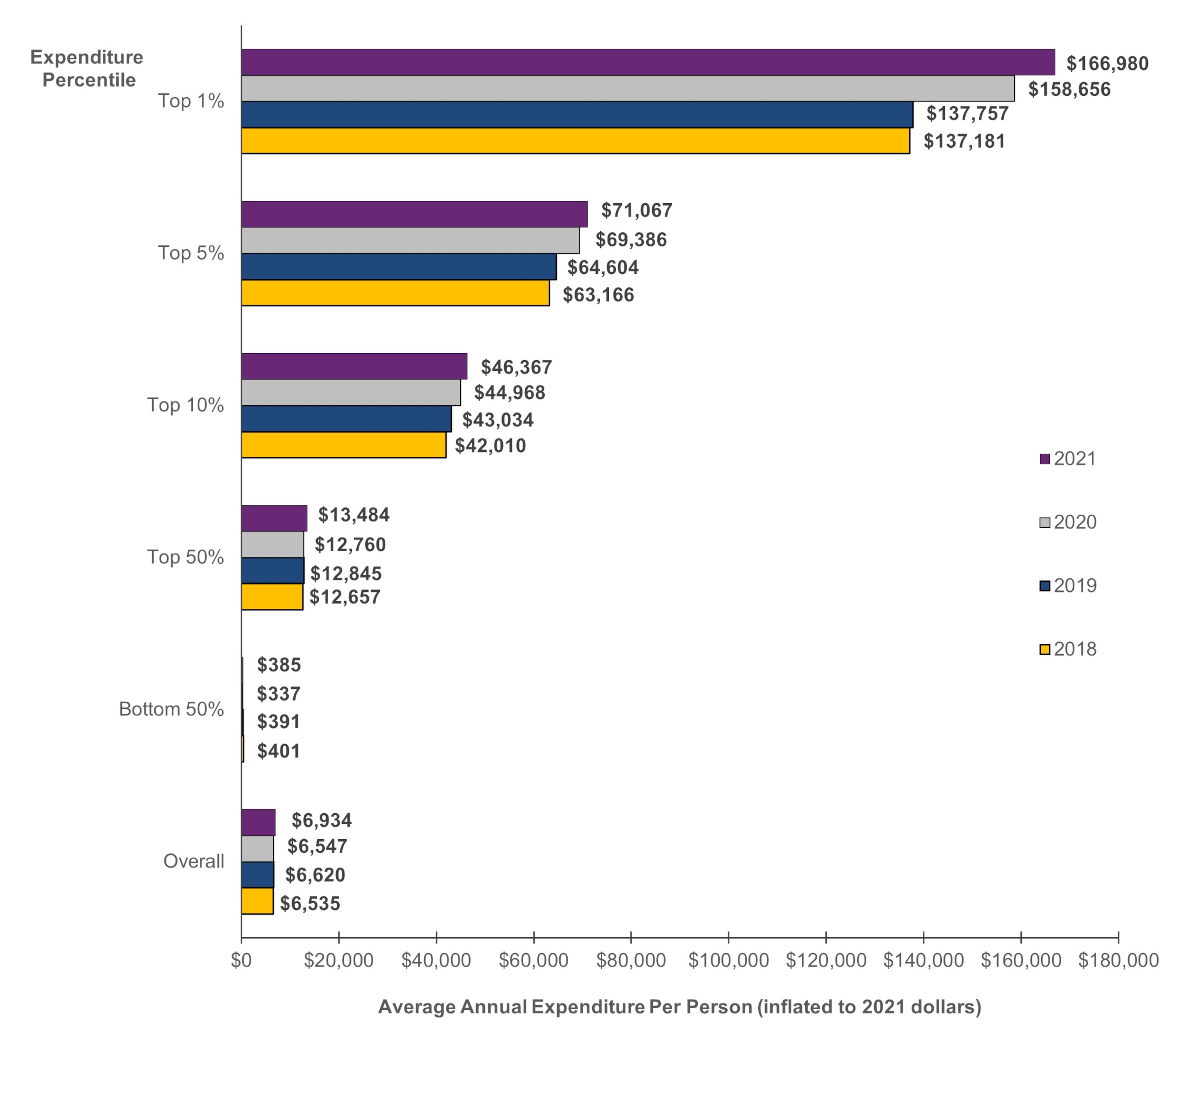
The bottom half of the US spending distribution spends around $400 a year ON AVERAGE on healthcare. If we are really granular, we see a lot of people with zeroes (probably 20-25% of the population) and the median American probably spends about $1500 a year.
Now this is a huge indicator of the political challenges of health reform as most of the time, most people are barely touching the system. What is going on is probably working okay-ish for them and changing to high deductible health plans and underwriting for all doesn’t effect them just as switching to single payer as written by Bernie Sanders really won’t effect them. Most of the benefits and costs of the coverage debates are over 10% to 15% of the spending distribution and a decent chunk of that group is already covered by Medicare or Medicare Advantage so they don’t care either except to protect themselves.
Baud
Following the lead of broadband providers, what we need are
datahealth care caps to rein in the heaviest users. #GOPPlatformAnother Scott
Interesting.
Is there a breakdown somewhere of what the top 1-5% is being spent on, e.g. to see if Hoveround chair providers are bilking the system more over time; if the cost of fancy biologic drugs are going to kill us all in our beds; if treatments for chronic conditions are getting more rather than less expensive; if growing medical practices (who are eating all the stand-alone Drs offices) and hospitals conglomerates and rehab/nursing home/assisted living conglomerates are taking more of the pie; etc.?
I’d be very happy if “AI” could take a deep dive in giant databases like these and see if there are correlations and associations that need to be looked at more carefully by expert humans. We know that wannabe MotUs are always looking for ways to grab a piece of the healthcare pie (“pay me or you’re gonna die!!11”), so finding those choke points before they do is important.
Thanks for all you do.
Cheers,
Scott.
p.a.
Ohhhhh. These % are by total population. I’m so used to looking at econ/income stats I originally thought the y axis was by income, and was “???”
Starfish
@Another Scott: The top 1% is just that one dude taking all those pills every day trying to live forever.
oldster
Could you say more about what the x-axis represents? I still don’t get it. Percentiles of what?
(Not income — I figured that out eventually).
Is it ranking all of the people in the US by how much money each one spends on health-care per year? So, Susie with pediatric brain cancer is a 1%-er, because she spends all year in the cancer ward?
lowtechcyclist
Wonder what that would look like by income percentile.
lowtechcyclist
@oldster:
I think the X-axis is percentages of total health care spending that year.
The Y-axis is expenditure percentiles, that is, the ‘top 1%’ is the 1% of people who spent* the most on health care that year, etc. So the most medically expensive 1% of the population in 2021 were the cause of 24% of the health care spending in 2021. (Do I have that right, David?)
*Well, had it spent on their behalf, mostly, by insurance or government.
Baud
@lowtechcyclist:
That’s how I read it too.
gene108
@Another Scott:
One thing I learned on old Twitter from following disabled people is a term called ableist. People not needing devices to get around – canes, walkers, wheelchairs, mobility scooters, etc. – make offhand comments about people who use such devices.
I can’t picture people not needing a mobility scooter getting one just for funsies.
If better newer treatments are available, they would likely cost more. How much is it worth to the public for someone with CKD to be on a newer drug and prevent ESRD by several years? Or the diabetic patient to better manage blood sugar levels to prevent all the problems diabetes causes by a few more years?
Starfish
@gene108: The issue is not that there are better treatments costing more. There are existing treatments that have been around for years costing more or much more. Then, they are being disallowed by insurance companies as well.
Some dental clinics are just dropping insurance because the insurance companies are disallowing the materials used in modern dentistry.
AM in NC
It’s really interesting how most of us flit in and out of these different spending categories, depending on where we are in life and random stuff.
I was a 1% er (I’m assuming) when I needed an emergency C-section 21 years ago. And again this year with a sports injury requiring ACL surgery. Normally, though, my medical care is annual physical, immunizations, and multi-vitamin.
Trying to plan for such swings as an individual trying to select insurance coverage is not easy. I can’t imagine trying to game this out for entire populations of people.
topclimber
Dave, do these figures account for public spending or only private? (I think the latter).
One deficit hawk puts the government share of healthcare spending at 45%.
Fake Irishman
@gene108:
I don’t think the comment was casting suspicion on scooter users (which would indeed be ableist), but rather suggesting scooter providers are jacking up prices for necessary equipment to pad their profits at the expense of payers.
It’s like we’d criticize drug makers for charging out the nose for insulin: we’re not thinking diabetics are faking it, but mad at rent seeking behavior.
(incidentally, unlike most drugs, prices for durable medical equipment can be directly negotiated by the government)
Starfish
I think I misunderstood the graphs. I was not thinking about 1%ers in terms of medical expenditure. I was thinking rich people getting a lot of unnecessary surgeries because they can.
Brachiator
I don’t know if this chart does this, but I would exclude people she 65 and older, or have two sets of data.
daveNYC
What’s the takeaway on this set of charts, that most people don’t use a lot of healthcare over the course of a year, but when they do…. holy crap that’s a lot of money? I don’t really follow how a large percentage of the population not accessing the health care system for more than annual checkups or whatever means that that percentage of the population doesn’t worry about the financial hit they’d take if they ever had a health care issue or that they have no interest in reforming the medical care and insurance system in the USA to remove the (still large) financial hit that comes from being seriously ill in the USA.
Another Scott
@Fake Irishman: +1
Sorry for causing any reader heartburn.
My in-laws lived at home with us for around 5 years. We saw first hand the price gouging by medical equipment suppliers for needed equipment. I also remember the ubiquitous TV commercials for “free” power chairs, etc., that Medicare supposedly paid for (but to be fair, I haven’t seen anything like that recently.).
Some of that may be the nature of the beast, given all the regulations, safety requirements, paperwork, etc. But some of it seemed to be way, way over the top. (E.g. $1000 wheelchairs that one can get on Amazon for $100-$150 or so.) I’m interested in how those prices and percentages of total-spend have changed over time as the number of oldsters increase, etc. (I’m not advocating work by David or others; just hoping that someone is looking into how spending changes over time to see if oversight and regulations need to be adjusted.)
FWIW.
Cheers,
Scott.
WeimarGerman
I think the conversation needs to change.
Most of these people are affected. They pay premiums of $100s a month for the pleasure of a $3-5,000 deductible, and a narrow network of providers. Most are one major event away from bankruptcy due to medical bills.
These people are propping up the multi-million dollars salaries of health insurance executives. Unitedhealth Group gave its Board 10% raises while laying off tens of thousands of employees. Unitedhealth Group’s Chairman Steven Hemsley sold 100M of stock after hearing of a DoJ investigation before it was public.
The whole system is broken. There are no unaffected people in the US.
.
JAFD
When I had a heart attack in ’18, definitely made the top 1% (one of the three million ;-) ).
Since then, one of top 50%, $ for checkups, tests and pills. Fantasized once about coming home from //drug peddler// CVS with drugs costing a couple kilobucks, and now I do.
WeimarGerman
@Another Scott: My day job is building and reviewing AI for a healthcare company.
There is no altruistic use of AI where I am. Chatbots are used to avoid humans in call centers. AI is used to label people in risk tiers mostly to send reminders but also to steer people to approved/cheaper providers. AI will predict who is likely to lapse in their medication refills not for good but because it may avoid an ER visit or hospitalization. And many more.
Yes these models may do good for the member but their sole purpose is to make more money for the insurer.
satby
Reining in the ridiculous cost of prescription medicine has to be looked at too. I just got off the phone with a friend who’s battling to get the migraine Rx her doctor ordered because it works best for her because it was denied by insurance (maybe Medicare, maybe supplemental) in favor of one that costs $4k a month which works less well. I don’t buy it’s because of the R&D costs, pharmaceutical companies are positively raping the American consumer.
TBone
@WeimarGerman: amen to that. All of that. And #20 too.
Brachiator
@WeimarGerman:
I don’t like AI. I don’t trust AI. I think that companies are rushing in to use it without fully understanding how best to deploy it. But I have dreams of having my AI chatbot talk to my doctor’s AI chatbot to set up a medical appointment.
But isn’t this a good thing? And isn’t it good if it can be done efficiently?
I hear you, and I think that many companies do stuff that works against their customers and might even put them at risk, while the companies reap big profits. But I think that some companies try to align customer service with their business needs. I also don’t know how to force a company to be altruistic if it is run by greedy bastards.
Anonymous At Work
Curious about the figures and graphics for Top 5%, 10% and 50% EXCLUSIVE of the 1%.
TBone
How can insurers continue to reap profit from the sick and dying without AI to help them deny claims and authorizations, make ever-larger hurdles to receiving proper care and treatment, and to further assist in selling our medical data for training of even more AI? And so on…
Eunicecycle
@AM in NC: the same with us, that is, have one year that you’re in the top 1% but mostly in the lower brackets. I had breast cancer and had more than $100,000 in expenses (mostly paid by insurance.) Last year my husband had double bypass surgery, so he was over $100,000. Usually our expenses are in the few thousands. We don’t need any expensive medications and just have our normal checkups, etc.
WeimarGerman
@Brachiator: Agreed, but there’s a lot of mess underneath the covers.
For example, models need good data to make accurate predictions. Those reminders get sent to people who have participated in the health care system. But without participation the models cannot distinguish between a healthy triathlete and someone who cant afford their co-pay. People who can’t afford care are under-represented in the data and then have fewer AI driven nudges despite needing those nudges.
A great example of bias in medical AI is Dissecting racial bias in an algorithm used to manage the health of populations.
RevRick
One out of one hundred of us is/will be responsible for half of all health care spending, meaning that they are seriously sick, undoubtedly from some debilitating, chronic condition. That means 99 out of 100 of us will dodge that bullet, though one out of twenty will pile up extensive medical bills. The odds are that most of us will only have occasional interactions with the health care system. But, and it’s a huge but, we don’t know whether we will fall into the tiny minority or the vast majority.
Guessing wrong can be catastrophic, which is why we need some sort of system to spread the risk. Over the years I’ve spent thousands and thousands of dollars on homeowners insurance, but have made zero claims. One house fire could reverse that equation in minutes.
Martin
@RevRick: Yeah, this is it. Anecdotal – for quite a few years Ms Martin and I were in the bottom 50% – healthy, spending almost nothing on healthcare other than annual appointments, tests, etc. Then Ms Martin got pregnant, that pregnancy had an absurd number of complications, involved bed rest, home nurses, lots of machines that go ‘ping’, an extended hospital stay for her and then for our son. We went from bottom 50% to top 1% in a year – racking up over a million in medical expenses. And then the following year back to the bottom 50% where we stayed until she got pregnant again and we repeated that process.
The fundamental nature to how the industry operates is that we should expect the top 1% to increasingly soak up more resources because we will continue to try and cure/treat increasingly rare conditions that previously we would have just let die and that those expenses will always outstrip whatever productivity/efficiency gains you get farther down the stack. I don’t think that’s a bad thing (speaking as the partner of someone who just successfully had her cancer treated).
Paul Belliveau
Intermittent lurker, rare commenter.
1) I wanted to thank you for all the work you do one this site.
2) I’m teaching a high school Business Calc class, and I just introduced Lorentz curves and the Gini index on Wednesday, so I decided on a lark to make a Lorentz curve out of this data for 2021. Obviously the inequality was high, buy I intend to use that to discuss *why* it’s high and why unequal distribution is the entire reason for insurance premium pricing in the first place.
Again, thank you!