
American politics right now is basically a race of the registration tables against the mortality tables.
Charles Franklin has a great graph on Twitter looking at mid-term voter participation rates by age for 2010, 2014, and 2018.
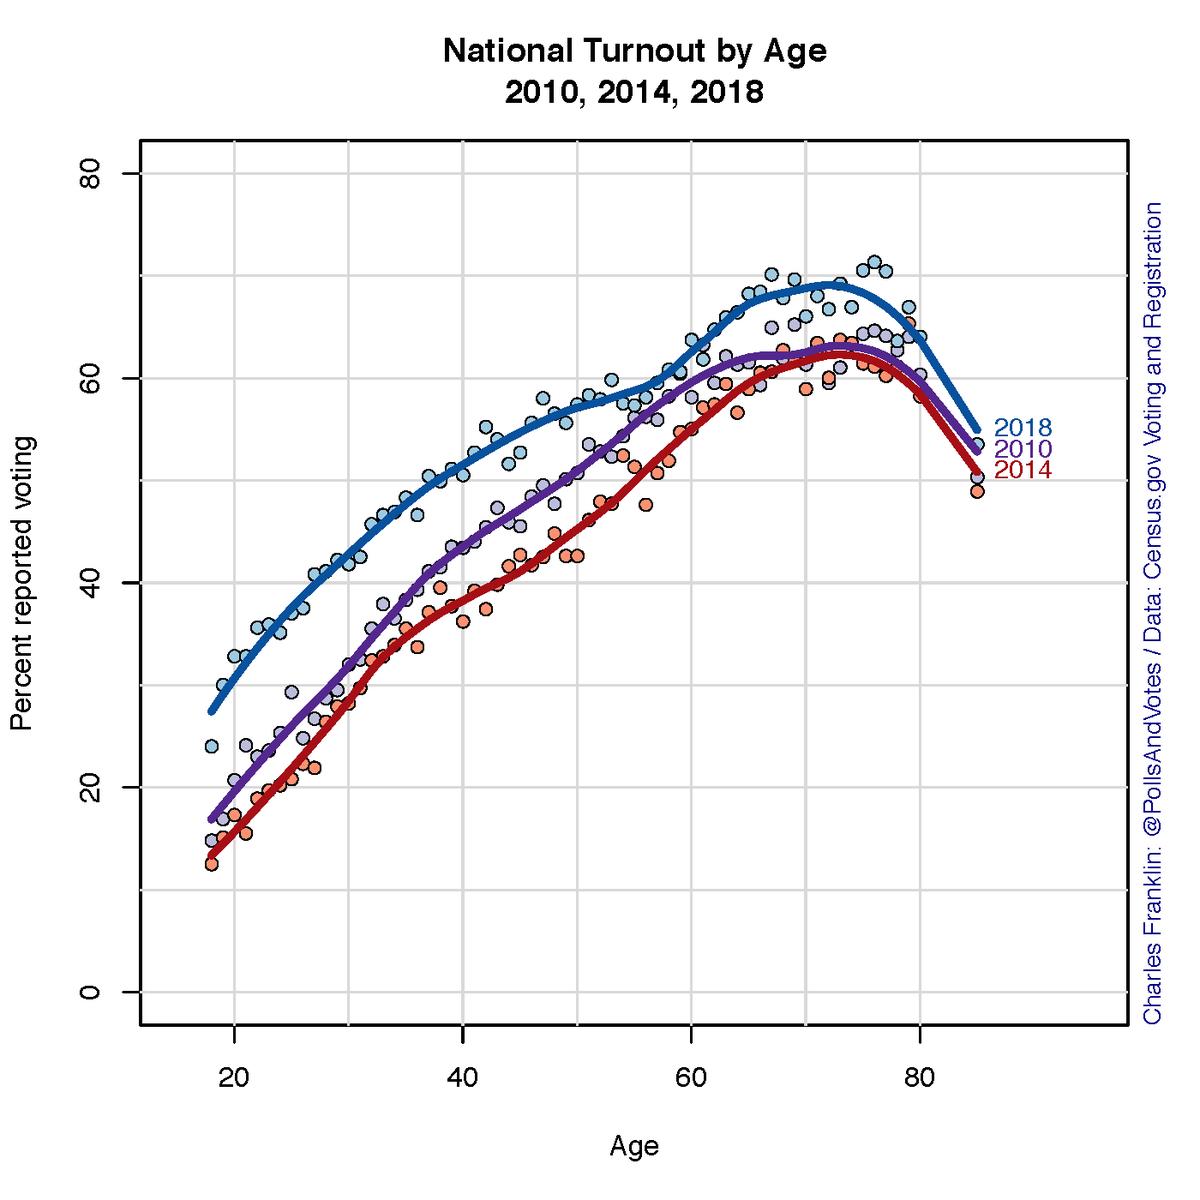
There are a few take-aways here. First, the probability of voting by age pretty steadily increases as cohorts age until about age 75 or so and then it drops off. Secondly, the slopes are fairly similar over time; it is a matter of levels for the differences in turn-out. Young voters increased their voting rates faster than almost any one else in 2018.
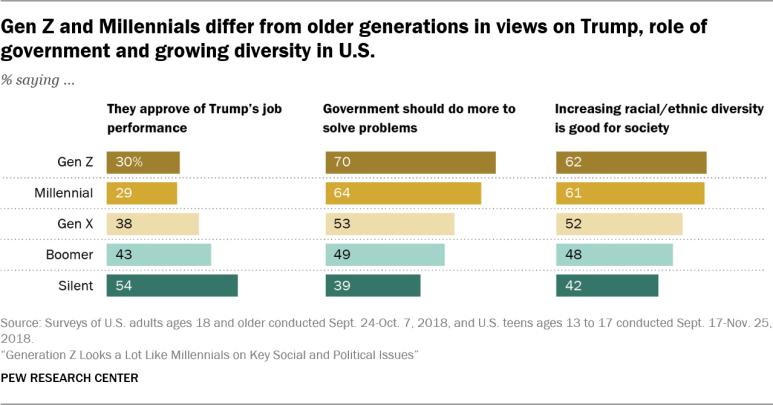
Age is a strong dividing line. Pew shows this nicely from a poll in January 2019:

Registration tables vs. Mortality tablesPost + Comments (37)